
For Financial Wellness in India CLICK HERE to visit nobias.in
For Financial Wellness in India CLICK HERE to visit nobias.in

Before you invest Nobias it!
Read high performing analysts with opposing points of view.
Make unbiased investing decisions, and stop falling prey to hot stock tips.
“The investor’s chief problem - and even his worst enemy - is likely to be himself.”
Investors tend to trust information that supports what they already believe, and ignore information that contradicts those beliefs.
Nobias helps evaluate information more effectively, without bias, to help you make smarter decisions.

Get vetted Investing Information
No bias. Unbias yourself with opposing perspectives from vetted authors.
No B.S. Fight back against misinformation online. Improve financial literacy and be better informed by reading sorted articles from top performing analysts and bloggers.
NO BIAS
$
NO B.S.
$
NO BIAS $ NO B.S. $

Increase the likelihood of a successful decision
The market is no longer a fair game. Information online is rigged with manipulation, mis-information and bias.
Nobias uses AI tools including natural language processing and machine learning to research, source, collate, process, analyze and present information in an easy to digest format so you can be a better informed investor, voter, consumer.

Analyse the Analysts
Is that famous analyst that good? How often has he been right? How much money would you make if you followed his advice?
Hold authors accountable with ease. Assess a writer’s credibility before you act on their advice, and see how their stance compares to the wider market sentiment.

Data-driven, unbiased
information
Browse thousands of stocks with articles from top performing Wall Street analysts and financial writers in one place.
It’s like having 3000 trained analysts working for you 24/7
Featured in


Proud Member Of


Free Chrome extension
Download our free companion extension and see article bias and author credibility when you browse!
No Bias. No BS. Arrive at a balanced news picture, comparing bullish and bearish perspectives from top performing authors with ease.

Nobias Spotlight
“What the bad actors want is your attention, they believe that the longer they can get you to stay on the page, the easier it is to suck you into their vortex.” Sam Wineburg, Stanford History Education Group
Recent articles on Spotlight Finance: Case Study: Accenture (ACN) stock according to high performing analysts
Recent articles on Political Spotlight: Trump’s Efforts to Destroy DeSantis
Subscribe here to get our weekly digest!
No BS. No Bias. See for Yourself.
Available for

Case Studies


Our Rating Criteria
= Explanation
Bias Rating

= This article is neutral on this stock. That means the author expects the stock to hold in value

= This article is bullish on this stock. That means the author expects the stock to rise in value

= This article is bearish on this stock. That means the author expects the stock to fall in value

= Expectation Unknown
Current Nobias Status
Criteria: Article-level Bias, Surrounding Market Bias, Author Credibility
Platforms: Facebook News Feed, Google News Feed and Google Search
Region: U.S. only
How We Determine Bias Rating
An Overview

Nobias processes thousands of articles every day and uses machine learning to surface whether an article is bullish or bearish.
We also zoom out and give you context–the overall market sentiment on a particular stock.
Let’s see how we break this down.
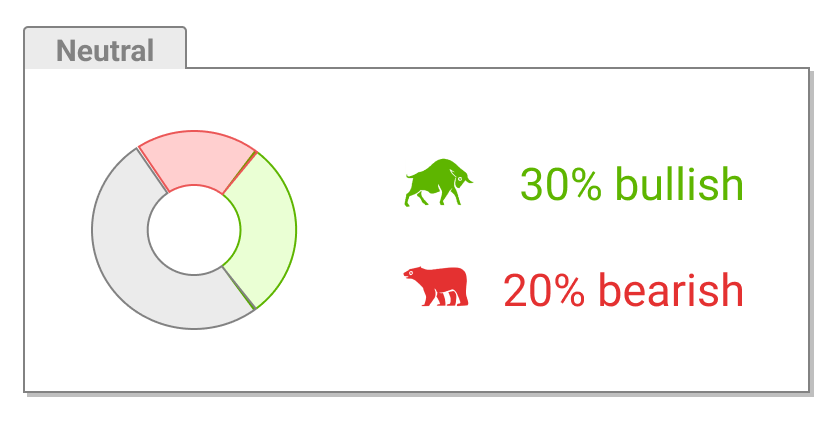
You can see in the image to the right that we highlight the sentiment of the article on Johnson and Johnson to be bullish. We also show you in the donut chart on the top right the distribution of sentiments across all articles written on Johnson and Johnson–this is the market sentiment. Hover over the segments to view how many articles are written from each side.
To obtain our bias rating, we employ proprietary Natural Language Processing (NLP) and Deep Learning methods, built on Nobias’ own and the latest research in Machine Learning.
How We Determine Credibility Rating
An Overview
Nobias processes thousands of articles every day and tracks the performance of the analysts and bloggers you read using unbiased, transparent methodologies. We want you to decide for yourself who to trust.
Let’s see how we break this down.

As shown in the image above, this analyst is ranked #3 in our database of 8,100 analysts and bloggers. Out of his 597 total recommendations, he has been accurate 67% of the time. If you followed all of his recommendations over three months, you would have an average return of 57%. At the time of this snapshot, this analyst was bullish across 100% of the stocks and ETFs he wrote on.
All of this results in a five star credibility rating for this author. We determine our stars using a combination of:
Accuracy Rate - The percent of their recommendations that were correct 3 months following publishing.
Average Expected Return - The expected return of the author’s recommendation in the 3 month period (for bloggers) or in a 1 year period (for analysts) following publishing.
The number of articles an author has written.
Dive deeper into our credibility ratings
The Goal
Nobias seeks to devise a statistically sound method for rating financial authors and analysts. For every author there are 3 fields: the total number of calls made, accuracy, and expected return. All were collected by keeping track of articles they have published (LexisNexis live feed), determining the stock they were discussing (regex-like checks), determining the positive/negative slant in the way they discussed the stock to generate a buy/sell/neutral slant, and then during the 3 months that follow, we check whether the slope of the stock price was in fact aligned with his recommendation and to yield a profit (or a loss). Expected return is based on purchase of $100 worth of shares on the day of his prediction (this may be fractional), and the total average return after holding the stock for a specified time period (3 months in our first case.) Accuracy and Expected Return are averaged across all calls. In the case of analysts we allow for a longer (1 year) time frame or until the Price Target recommended by the Analysts is achieved or the Analyst revises his recommendation.
